Your first diagram
A five-minute walkthrough from a fresh sign-in to a saved, shareable diagram. You'll draw two boxes, connect them with an arrow, add a label, rename the file, and copy a share link.
You're signed in and the dashboard is showing an empty Default folder. The fastest way to learn the editor is to build something tiny — a two-box flow with a labelled arrow. End to end, this takes about five minutes. By the time you're done you'll have used the rectangle tool, the arrow tool, the text tool, the title bar, and the share dialog — five of the six things you'll touch 90% of the time. Every step below is point-and-click; the matching keyboard shortcut sits in a parenthetical at the end of each step for when you want to speed up later.
Step 1 — Create a diagram
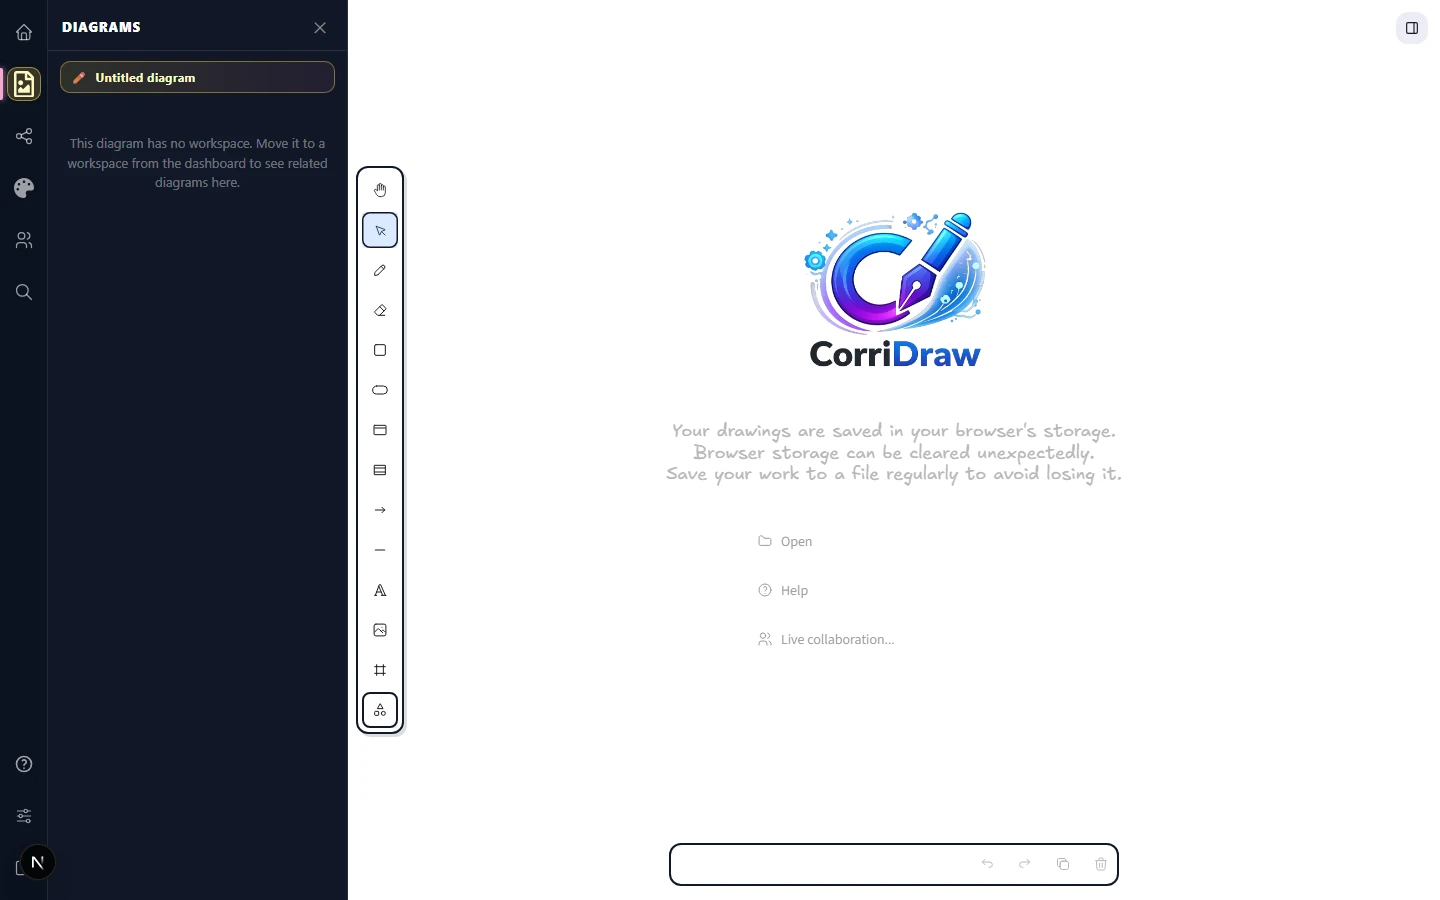
On the dashboard, click the big New diagram button. The editor opens immediately at
/editor/<new-id> with a blank infinite canvas, the shape toolbar running
vertically along the left edge of the canvas, and a welcome screen overlay showing the
CorriDraw logo with quick-action links — Open, Help, and Live
collaboration. The welcome chrome disappears the moment you start drawing.
Step 2 — Draw a rectangle
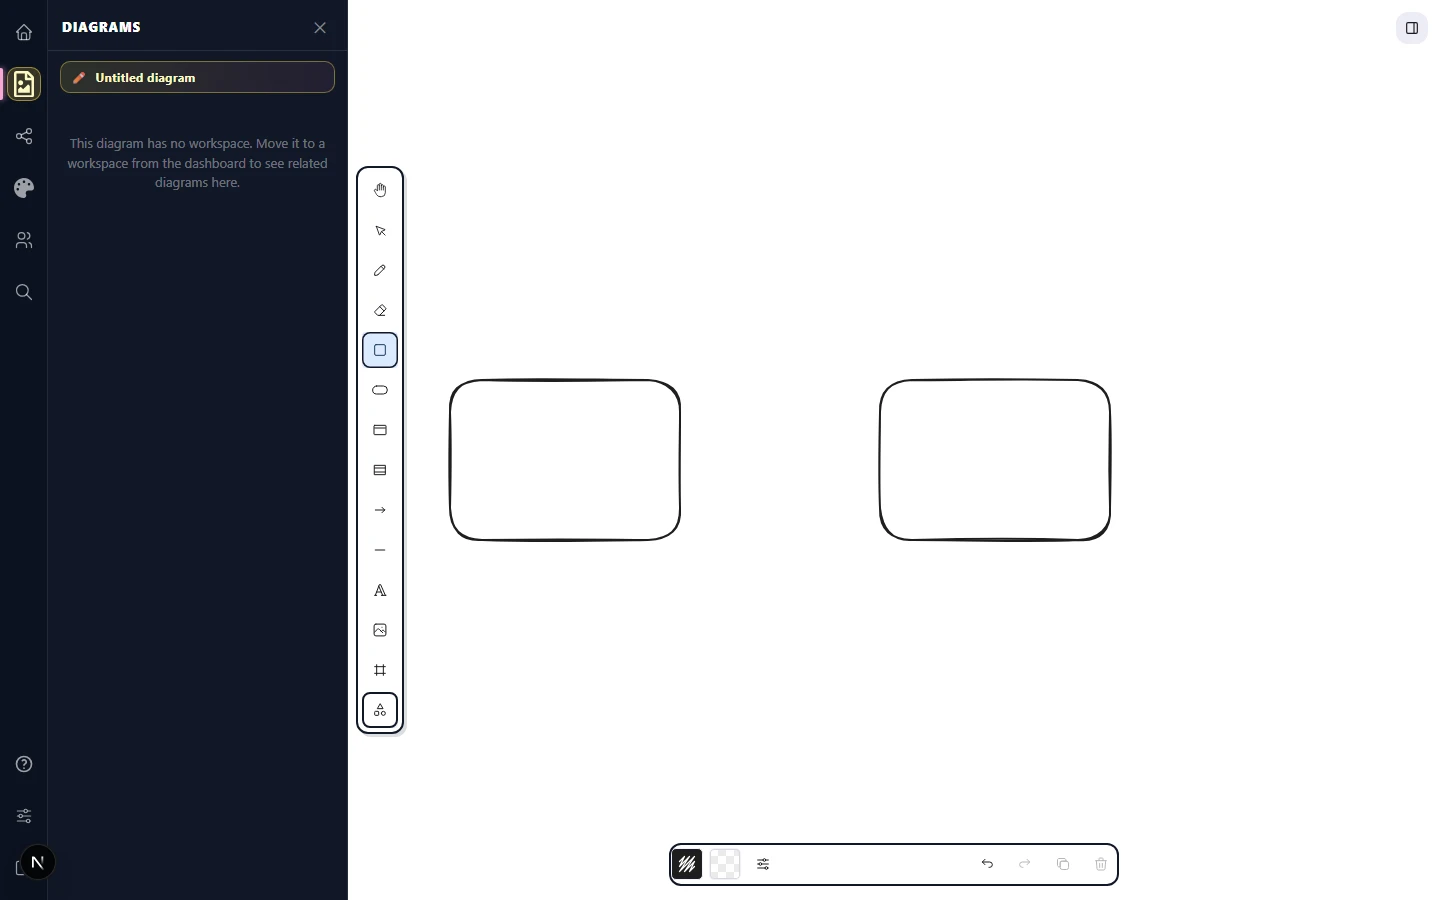
Click the rectangle icon on the shape toolbar that runs along the left edge
— it sits between the eraser and the ellipse icon. The cursor turns into a crosshair to
confirm the tool is armed. Click anywhere on the canvas, drag to define the size, and
release. You just placed a rectangle. Hold Shift while dragging to lock the
proportions to a square, and hold Alt to draw outward from the center instead of
from the corner. On a tablet, tap and drag with your finger or pen — the gesture is
identical.
To make a second rectangle, click the rectangle icon again and draw another one a few hundred pixels to the right of the first.
Step 3 — Connect them with an arrow
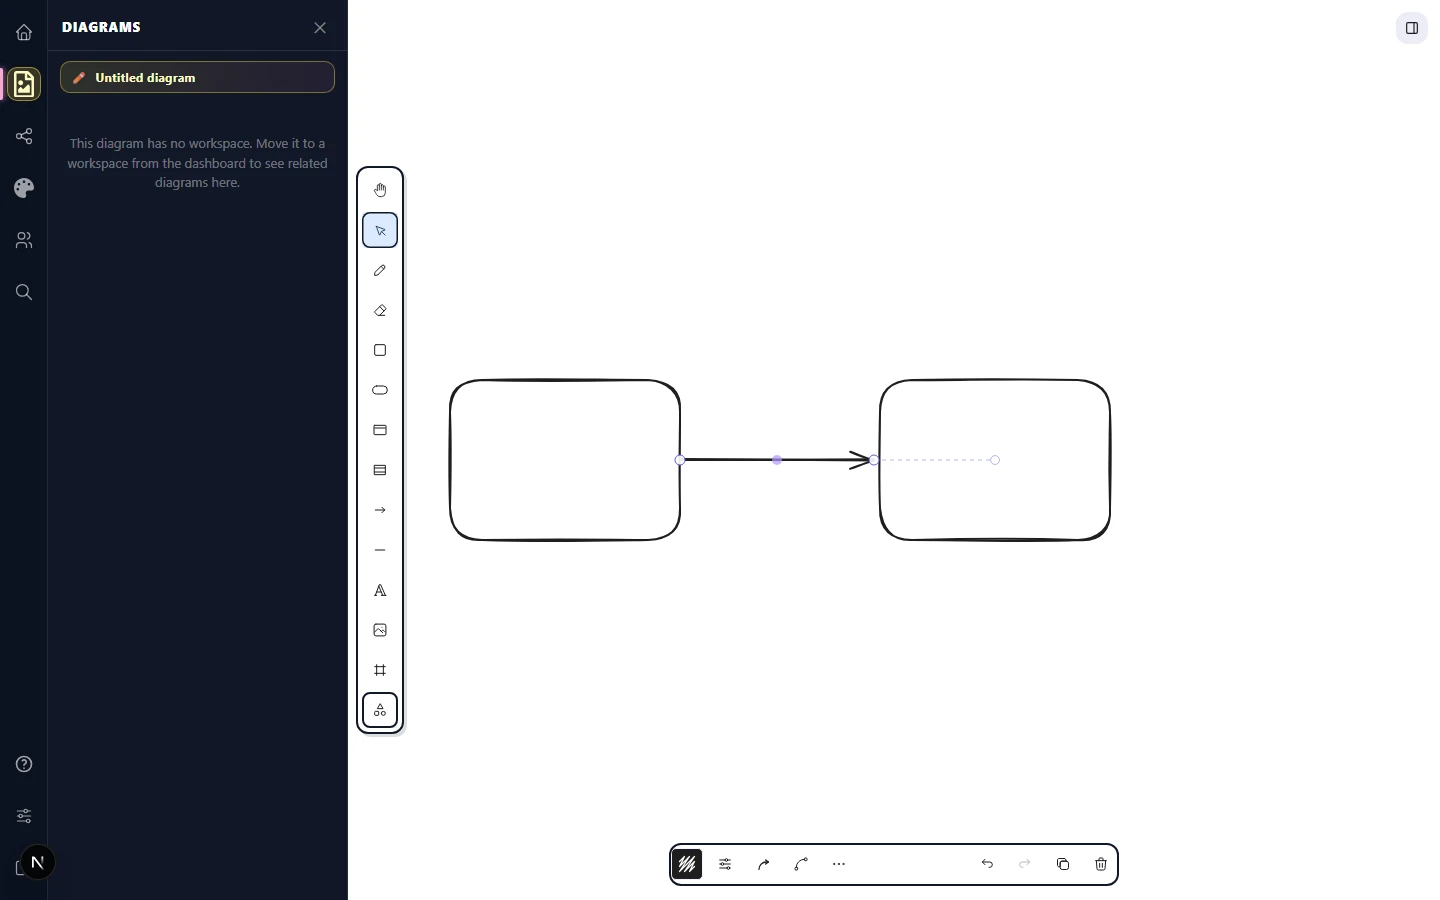
Click the arrow icon on the left-edge toolbar — it sits below the shape
cluster and above the line tool. With the arrow tool armed, hover over the right edge of the
first rectangle. A binding endpoint marker snaps onto its border — that's the visual signal
that the arrow's tail will bind to the shape. Click to anchor the tail, drag toward
the second rectangle, and a second marker snaps onto its left edge. Release. The arrow now
connects the two boxes and stays connected when you drag either of them around.
(Pro tip: press A to grab the arrow tool from the keyboard.)
Bound endpoints survive moves, resizes, and rotations. To break a binding, click the
selection icon on the toolbar (the arrow cursor, second from the top), grab
the arrow's endpoint, and drag it off the shape — the binding marker disappears and the
endpoint becomes a free-floating dot. (Pro tip: press V to grab the
selection tool.)
Step 4 — Add a label
There are two ways to add text:
- Click the text icon on the toolbar (looks like a capital A, sits
between the line tool and the image tool), then click on the canvas where you want the label
and start typing. Click outside the text or press
Escto commit. This makes a free-floating label. - With the selection tool active, double-click inside any shape — even on a touchscreen, a double-tap works the same way. The shape becomes a text container — the label sits inside it, resizes with it, and centers automatically.
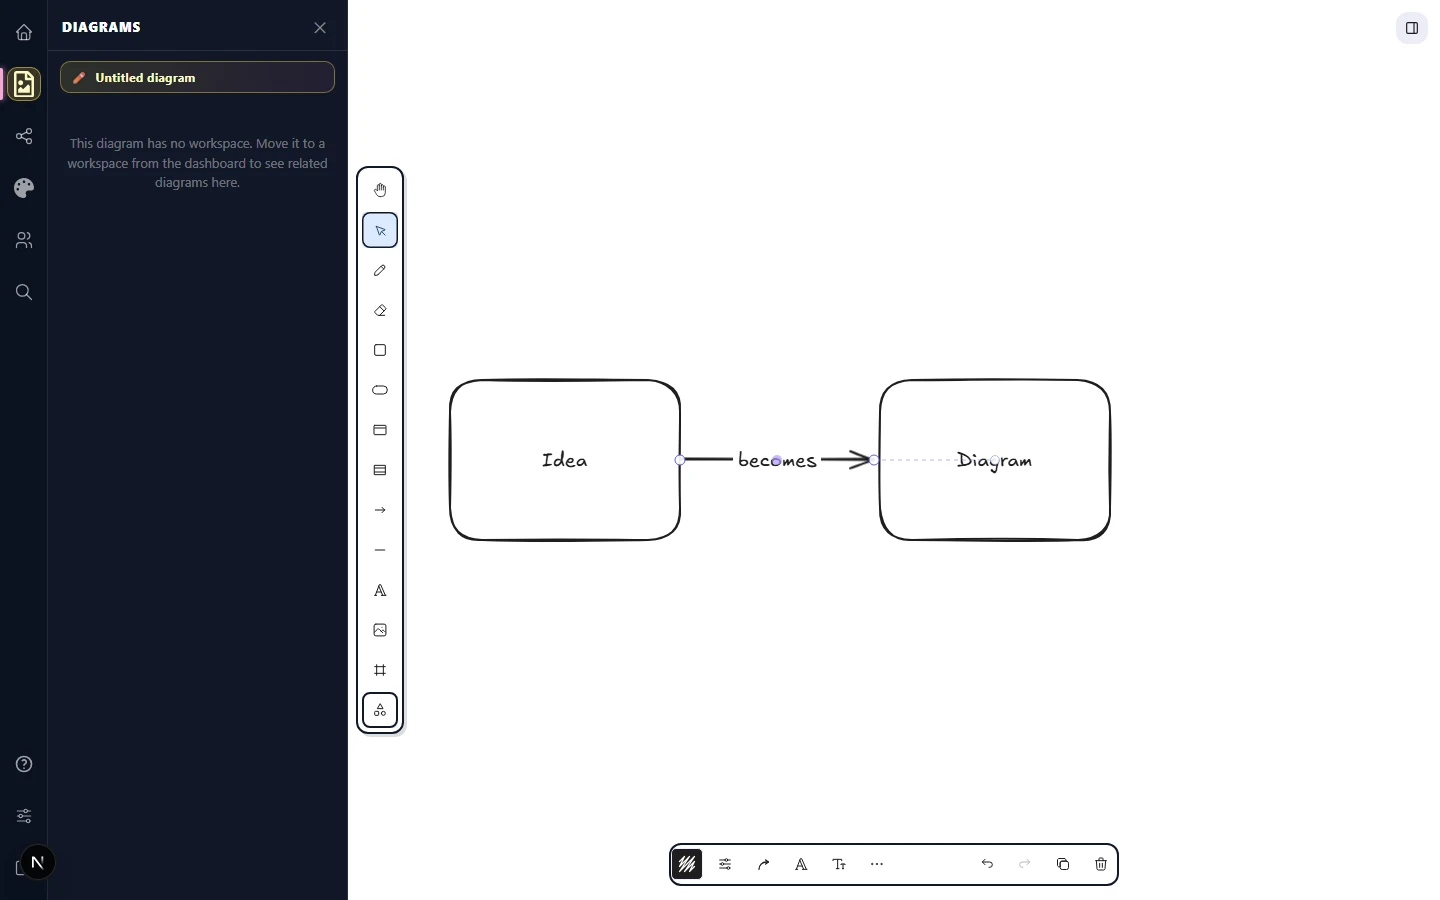
Double-click the left rectangle and type Idea. Click outside the shape to
commit. Double-click the right one and type Diagram. To label the arrow itself,
double-click the arrow and type becomes; the text rides along the arrow even when
you reroute it. (Pro tip: press T to grab the text tool from the keyboard.)
Step 5 — Saving
You don't have to do anything. The editor autosaves continuously — every change is queued to the server within a second or two. The save indicator next to the title bar flicks to a spinner while a save is in flight and back to a checkmark when it lands. There's no save button to hunt for.
Two caveats are worth knowing about:
- Guest mode (no account) saves only to
localStoragein this browser. Clear site data and the diagram is gone. Sign in to mirror to the server. - Offline edits queue locally and flush the next time the browser reconnects. The dot turns yellow while you're offline so you know writes haven't shipped yet.
If you ever want a hard local snapshot, click the hamburger icon in the
top-left corner to open the Main menu, then choose Save to disk. That writes a
.corridraw file you can re-open later from the same menu.
(Pro tip: Ctrl+S / ⌘+S triggers the same save-to-disk
dialog.)
The top-center title bar showing the diagram name on the left and a small green checkmark icon on the right indicating 'Saved'. Just to the right is the autosave timestamp 'Saved a moment ago'.
/screenshots/docs/first-diagram-5.png Step 6 — Rename the diagram
The title bar sits at the top center of the editor, between the toolbar and the canvas. New
diagrams are called Untitled by default. Click the title text once — the entire
string becomes editable inline. Type a new name, then click anywhere off the field to commit.
The new name persists to the server with the next autosave and shows up on the dashboard
immediately. (Pro tip: Enter commits the rename without moving your hand to
the mouse.)

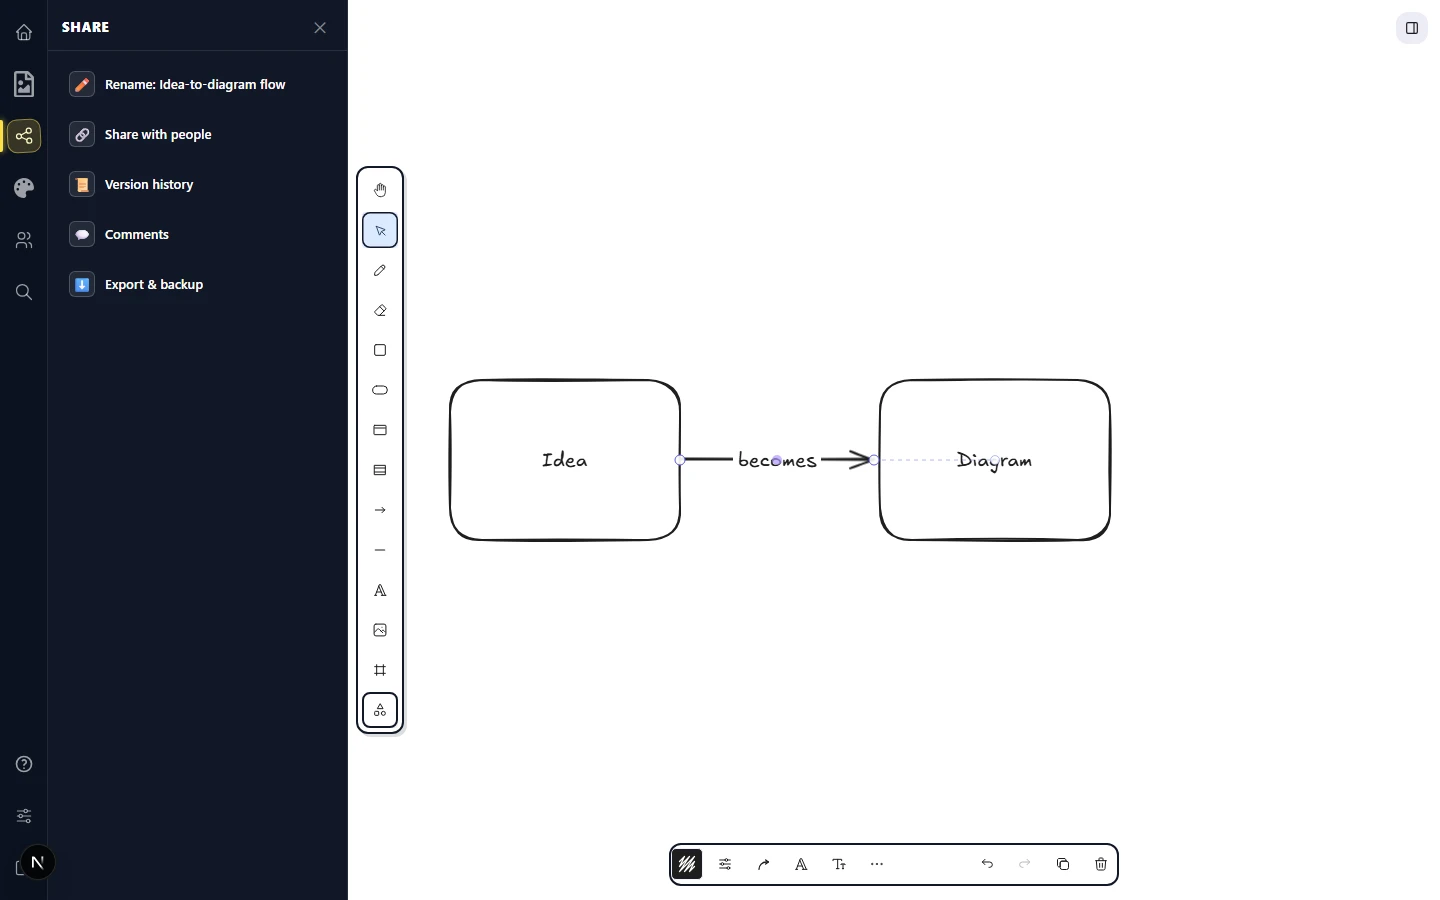
Step 7 — Share it
The fastest way to share what you just drew is the Share panel in the activity bar on the left edge of the editor. Click the share icon in the activity bar (the one shaped like a paper plane / share glyph) to open the panel. It surfaces a stack of sharing tools:
- Rename — quick rename of the current diagram without leaving the panel.
- Share with people — opens the dialog where you generate a
live collaboration link (real-time, presence cursors, edit permissions) and a
read-only public link (static snapshot at
/p/<hash>). - Version history — browse and restore earlier autosaves of the diagram.
- Comments — read and post pinned comments. Comments stick to a spot on the canvas; drag the pin to move it, click the checkmark to resolve.
- Export & backup — download the scene as
.corridraw, PNG, or SVG.
Click Share with people, then Copy link next to either link type. The
button briefly flashes Copied! so you know the clipboard has it. Paste into Slack,
an email, a doc — anywhere a URL goes. (Pro tip: Ctrl+Shift+S /
⌘+Shift+S opens the Share panel from the keyboard.)
What's next
You drew, connected, labelled, saved, renamed, and shared a diagram. That's the complete loop. From here, the manual splits into focused chapters:
- Map every part of the editor UI in Anatomy of the editor.
- Explore the full shape catalogue in Shapes.
- Learn arrow types and bindings in Arrows & lines.
- See how to invite collaborators in Share a link.