PlantUML → diagram
Paste PlantUML source, render it through a PlantUML server, and drop the SVG onto your CorriDraw canvas — with self-host options for privacy.
The PlantUML tab gives you a fast path from @startuml … @enduml source to a finished diagram on your canvas. Unlike the Mermaid tab, there is no native CorriDraw parser for PlantUML yet — the dialog encodes your source, sends it to a PlantUML server, and inserts the SVG response as a single image element. That is the exact same render path PlantUML produces everywhere else, so the result matches what you see in IntelliJ, VS Code, Confluence, or your wiki.
This page covers the paste flow, the diagram families that PlantUML handles best, the privacy implications of the default public server, how to point CorriDraw at your own self-hosted PlantUML server with one environment variable, and a runnable example you can paste in.
The paste flow
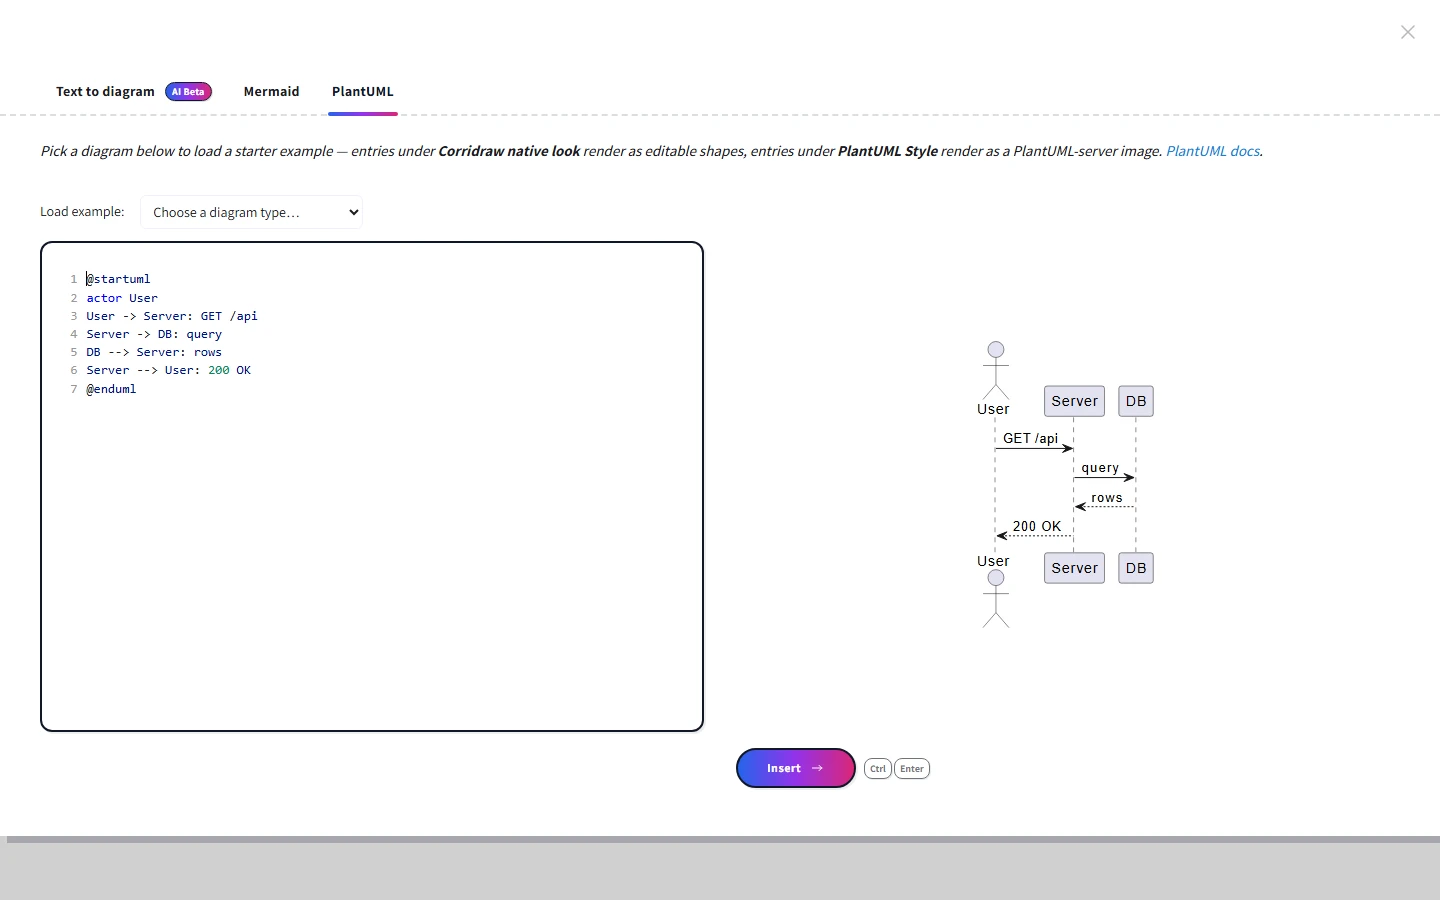
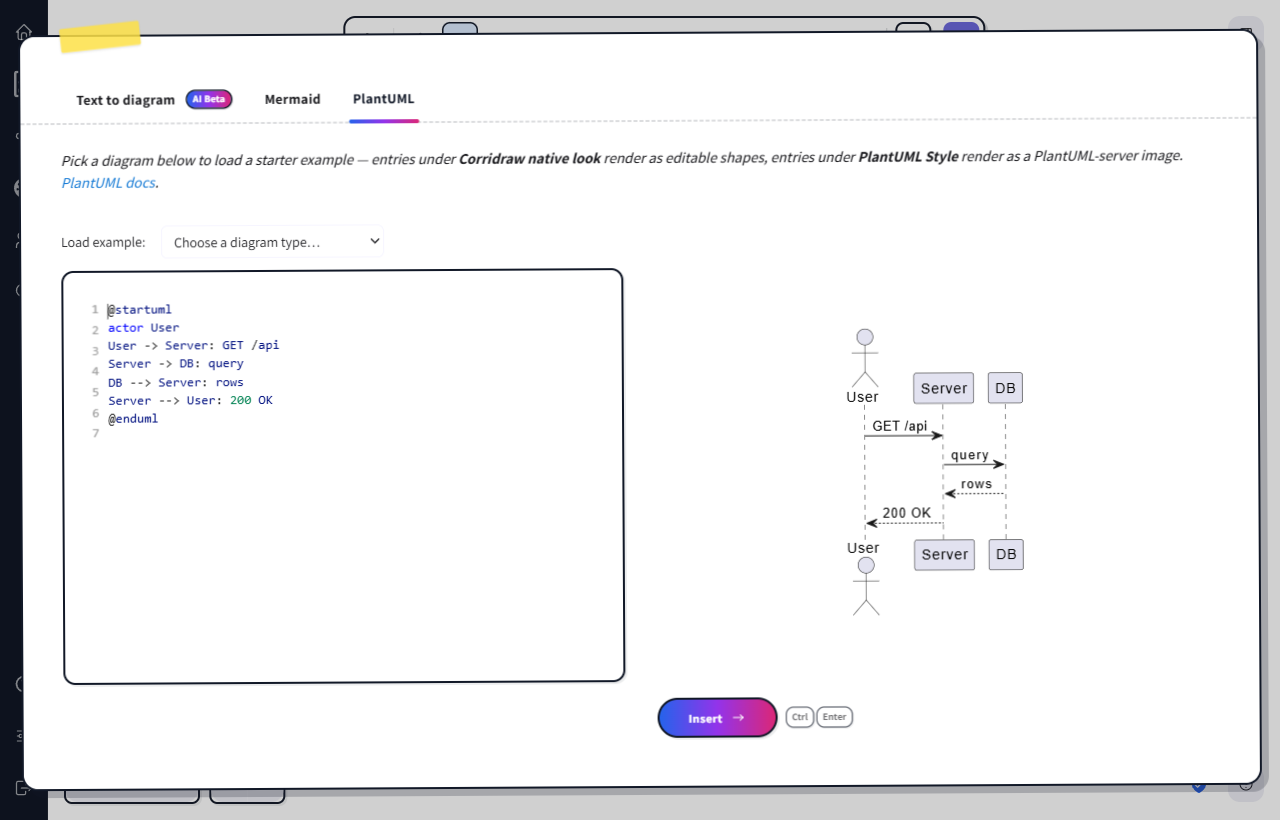
Click the three-dot extra-tools menu in the top toolbar and click PlantUML to Corridraw to open the dialog directly on the PlantUML tab. (Alternatively, open the command palette, click Text to diagram, then click the PlantUML tab.) Then:
- Click into the left-hand editor and paste your
@startuml … @endumlsource. The preview re-encodes and re-fetches as you stop typing (debounced, so big diagrams stay responsive). - The right-hand pane shows the SVG returned by the PlantUML server. PlantUML renders syntax errors as part of the SVG itself, so a broken diagram still displays — just with the error message inside it.
- Click the Insert button at the bottom-right of the preview pane. CorriDraw downloads the SVG, reads its intrinsic dimensions, and inserts it as a single image element centred at your viewport.
Your source is saved between sessions in localStorage under plantuml-to-corridraw. The dialog closes automatically on a successful insert because PlantUML always produces a single image — there is no incremental editing model the way there is on the Mermaid tab.
Supported diagram types
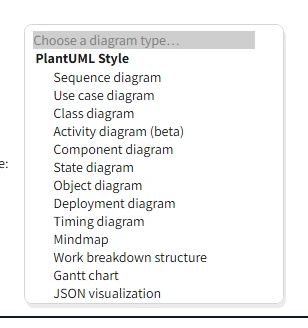
PlantUML covers a wider set of diagram families than Mermaid. Click the Load example dropdown above the editor and you will see starter examples for the ones we see most often:
- Sequence diagrams — actors, participants, sync messages, async messages, lifelines.
- Activity diagrams (beta) — start/stop, decisions, parallel branches, nested if/else.
- Class diagrams — classes with attributes and methods, inheritance, association.
- Component diagrams — packages, components, dependencies between them.
- Deployment diagrams — nodes, databases, network connections with protocol labels.
The dialog also includes examples for use case, state, object, timing, mindmap, work breakdown structure, gantt, and JSON visualization diagrams — click any of them in the dropdown to load the source and see exactly what syntax the server expects.
The default server is public — read this first
Out of the box, CorriDraw sends your PlantUML source to https://www.plantuml.com/plantuml, the public server run by the PlantUML project. Your source is encoded into the URL and the server returns an SVG. That is fine for public diagrams, throwaway sketches, and learning, but you should know what it means before you paste anything sensitive.
If your work is sensitive — and most architectural diagrams are — host your own PlantUML server and point CorriDraw at it.
Self-hosting the PlantUML server
The PlantUML project publishes an official Docker image that bundles the renderer with a small Jetty web server. One command starts it locally:
# Run the official PlantUML server on port 8080
docker run --rm -d \
  --name plantuml-server \
  -p 8080:8080 \
  plantuml/plantuml-server:jetty
The server then serves SVG, PNG, and TXT renderers at http://localhost:8080/plantuml/svg/<encoded>, which is the exact URL shape CorriDraw expects. For a real deployment, run the same image behind your reverse proxy on a private hostname (for example https://plantuml.internal.example.com) and treat it like any other internal service — same auth boundary, same TLS, same monitoring.
Pointing CorriDraw at your server
The PlantUML server URL is configurable per deployment via an environment variable. CorriDraw reads it at build time, so the host application — whether you use the Next.js host or embed the editor in your own Vite app — picks it up automatically:
NEXT_PUBLIC_PLANTUML_SERVER_URL— read by Next.js builds (the defaultcorridraw-app/host).VITE_APP_PLANTUML_SERVER_URL— read by Vite builds, for embedding the editor in your own app.
Set whichever one matches your build pipeline to the base URL of your PlantUML server, without a trailing /svg/:
# .env.local for the Next.js host
NEXT_PUBLIC_PLANTUML_SERVER_URL=https://plantuml.internal.example.com

# .env for a Vite-based embed
VITE_APP_PLANTUML_SERVER_URL=https://plantuml.internal.example.com
CorriDraw strips a trailing slash if you include one, then appends /svg/<encoded source> for both the live preview and the SVG fetch performed at insert time. There is no per-user override in the UI — the server URL is a deployment-level setting, set once by whoever runs the host application.
A runnable example
Open the PlantUML tab from the toolbar's three-dot menu and paste the snippet below. You should see a four-actor sequence diagram in the preview pane: a user calling a server, the server querying a database, and the response flowing back up.
@startuml
actor User
User -> Server: GET /api
Server -> DB: query
DB --> Server: rows
Server --> User: 200 OK
@enduml
Click the Insert button (or press Ctrl+Enter) and the rendered SVG drops onto your canvas as an image element. From there it behaves like any other CorriDraw image — you can drag it, scale it from its corner handles, group it with annotations, and embed it in a frame. To edit the diagram itself, reopen the dialog from the toolbar, tweak the source, and click Insert again.
Common pitfalls
- The preview shows an error SVG. PlantUML renders syntax errors visually instead of returning HTTP 4xx, so the preview pane never goes blank. Read the message inside the SVG to find the offending line.
- The browser console reports a 414 / URL too long. PlantUML encodes the entire source into the URL. Diagrams of more than a few hundred lines can exceed your reverse proxy's URL length limit. Raise the limit on the proxy, or split the diagram into smaller views.
- The fetch fails with a CORS error. The default public server serves permissive CORS headers. A self-hosted server may not — make sure your reverse proxy adds
Access-Control-Allow-Originfor the host that serves the editor.
If you also use Mermaid, take a look at the Mermaid → diagram page — the rhythm is the same, but Mermaid gives you editable native shapes for many diagram families instead of a single SVG image.